Visualizing absorption spectra#
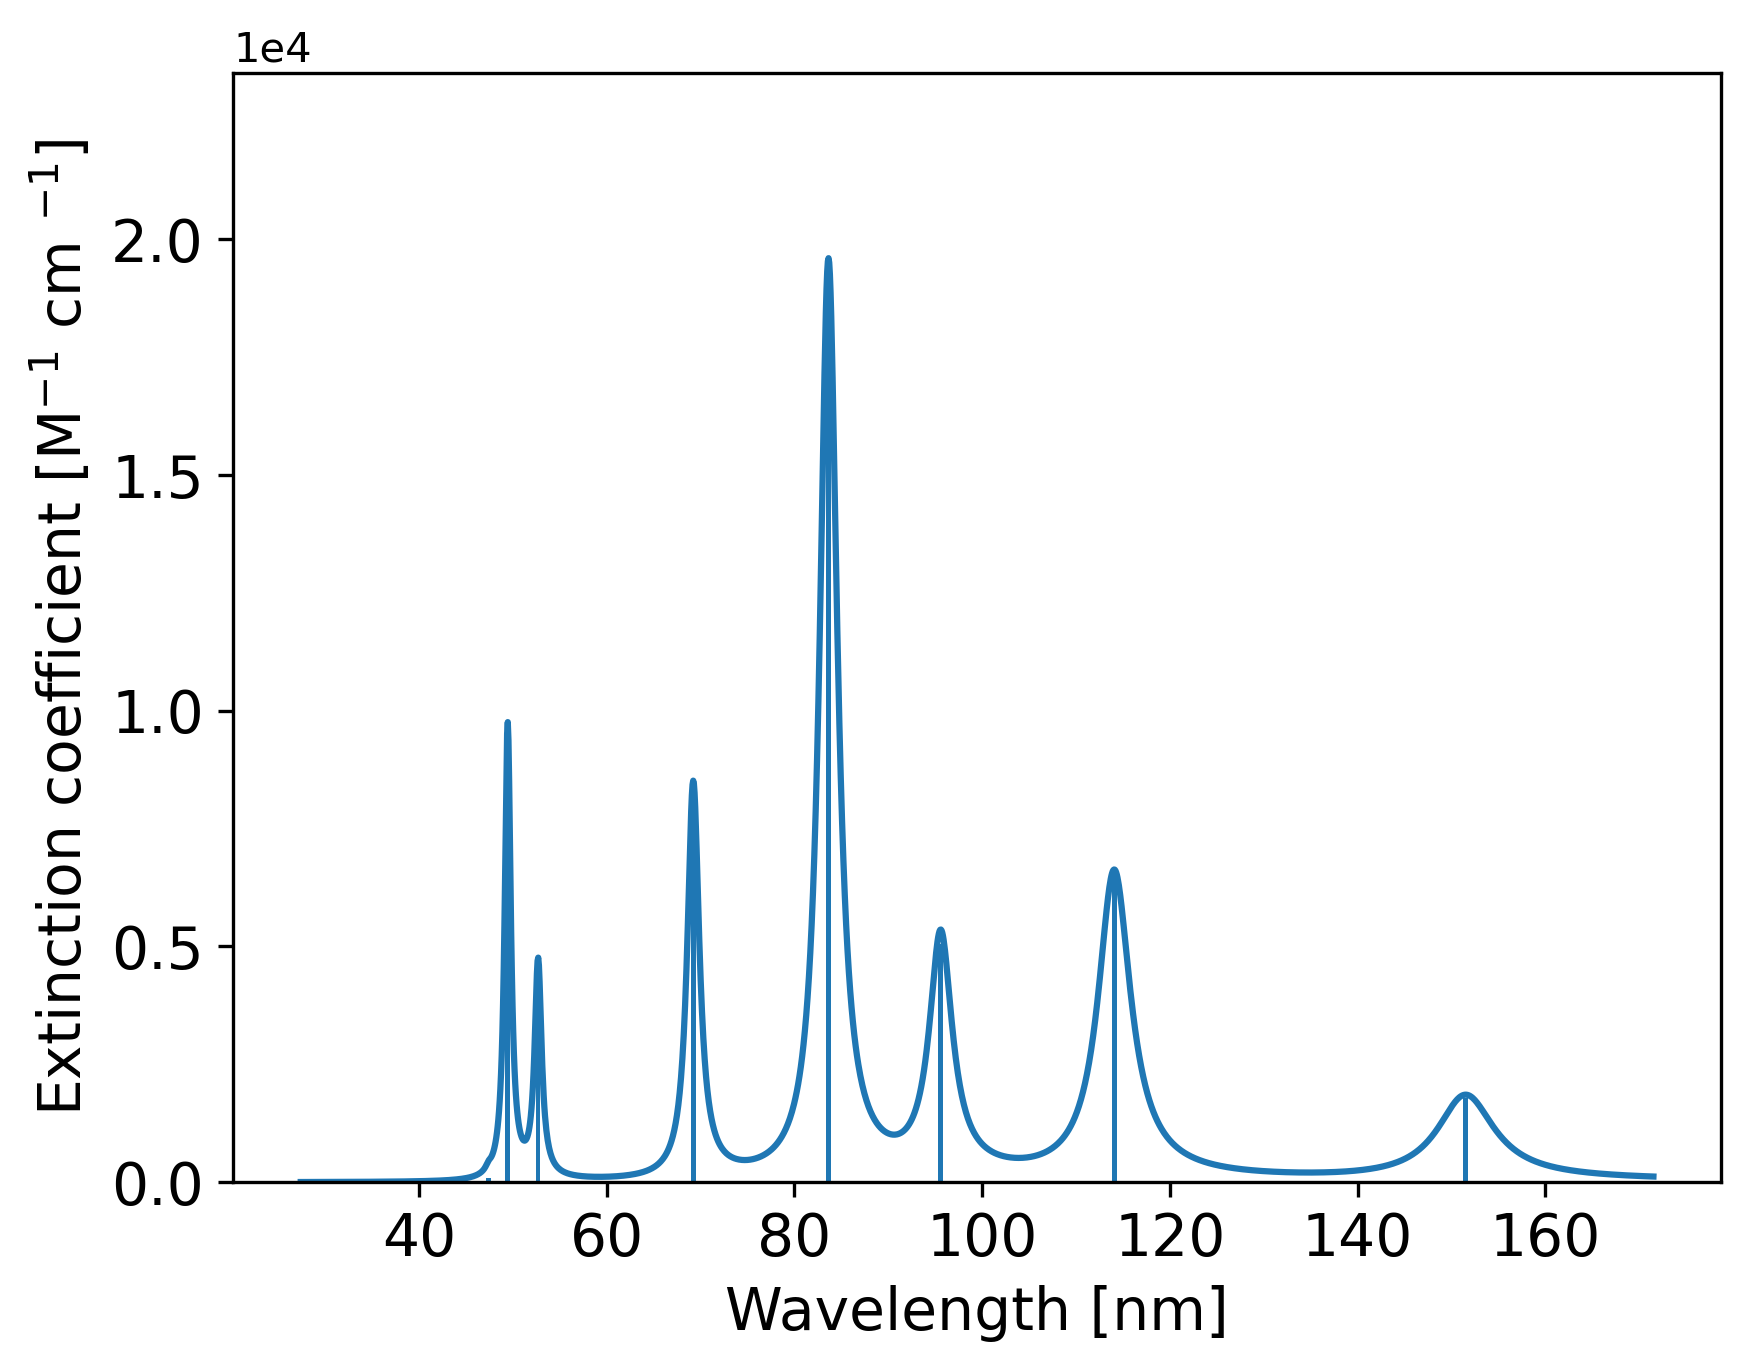
Absorption spectra can be generated and plotted directly in a Jupyter notebook by using the plot_spectrum command. The following example computes the first ten excitation energies for water at the CCSD level of theory and plots the spectrum:
import penguin
import veloxchem as vlx

xyz_string = """
    O     0.941414391         0.061806555         0.056540617
    H     1.897745723         0.036140170         0.097929548
    H     0.668559886        -0.421976725         0.836569836"""

molecule = penguin.get_molecule(xyz_string)
basis = penguin.get_molecular_basis(molecule, "cc-pVDZ")

scf_drv = vlx.ScfRestrictedDriver()
scf_drv.ostream.mute()
scf_drv.compute(molecule, basis)

reference_state = penguin.create_reference_state(molecule, basis, scf_drv)
ccsd_drv = penguin.CCSD()
ccsd_drv.ostream.mute()
ccsd_drv.update_settings({
    'reference_state': reference_state,
    'nstates': 10,
    'spectrum': True
})
ccsd_drv.plot_spectrum('lorentzian', 0.4, 'nm')